Up in under 10 minutes.
ARA is a single binary that stores every feature value your models ever see, lets you read any value back at any past moment in time, and records every decision alongside the exact inputs that produced it. This guide gets you from zero to a running instance writing and replaying decisions.
You will need: the download link from your registration email (the build is personalized to you), a one-time activation token from the activation page on first start, and Python 3.12+ for the SDK and Replay Console. About ten minutes end to end.
No build yet? Download ARA free here.
1. Download and extract
# Download link is sent to your email after registering on the download page.
# Your download's SHA-256 is shown on the confirmation page right after it
# completes (each download is patched with your license key, so it's a
# unique file - verify against that value, not a generic published hash):
#   shasum -a 256 ara-*-linux-*.tar.gz
tar -xzf ara-*-linux-*.tar.gz     # x86_64 or aarch64 - match your download
cd ara-*-linux-*/
2. Install
# Sets up the Python SDK venv and creates the data directory
./install.sh
3. Activate (first run only)
Activation is a three-step loop, and you don't need a token to begin - the first run gives you everything:
# STEP 1 - start the server with no token. It will not fully start yet:
# instead it prints this machine's ACTIVATION CODE and the exact URL
# to exchange it at.
./bin/ara-start.sh

# STEP 2 - open that URL in any browser, on any device (the code is
# what ties it to this machine). It returns a one-time activation token.

# STEP 3 - start again with the token. The server activates, starts,
# and stores the activation locally - the token is never needed again.
./bin/ara-start.sh --activate YOUR_TOKEN

# Every later start is just:
./bin/ara-start.sh
The server starts a worker pool sized to the machine (override with --cores N), each worker listening on its own port starting at 50051. The Python SDK discovers the worker count automatically when you construct ARAStore() against a running server - no need to match partition counts by hand (pass num_partitions= only if you construct the client before the server is up). Data persists across restarts - the server rebuilds from disk on startup. Community Edition: 2M Decision Units per calendar month, single node, 30-day history window.
4. Register your features
Tell ARA what features exist before writing. This powers the monitoring layer and the Replay Console.
source sdk/python/.venv/bin/activate
python3 - <<'EOF'
from ara_store import ARAStore, FeatureSpec

store = ARAStore()  # connects to localhost:50051+, auto-discovers partitions

store.register_features([
    FeatureSpec(name="risk_score",   group="model_inputs",  group_label="Model inputs"),
    FeatureSpec(name="amount",       group="model_inputs",  group_label="Model inputs"),
    FeatureSpec(name="approved",     group="model_outputs", group_label="Model outputs"),
    FeatureSpec(name="converted",    group="outcomes",      group_label="Outcomes"),
])
print("Schema registered.")
EOF
5. Write features
python3 - <<'EOF'
from ara_store import ARAStore
import time

store = ARAStore()

# Write feature values for entity 1234 (must be a 64-bit integer)
store.write(entity_id=1234, features={
    "risk_score": 0.82,
    "amount":     5000,
    "approved":   1.0,
})

# Batch write across many entities in one call
store.write_batch([
    {"entity_id": 1234, "risk_score": 0.82, "amount": 5000},
    {"entity_id": 5678, "risk_score": 0.41, "amount": 1200},
    {"entity_id": 9012, "risk_score": 0.09, "amount": 800},
], timestamp=int(time.time() * 1e6))  # microsecond timestamp
print("Written.")
EOF
6. Read back features
python3 - <<'EOF'
from ara_store import ARAStore
from datetime import datetime, timezone
import time

store = ARAStore()

# Latest values
latest = store.get_latest(entity_id=1234, feature_names=["risk_score", "amount"])
print("Latest:", latest)
# -> {"risk_score": 0.82, "amount": 5000}

# Point-in-time: what did entity 1234 look like at a specific moment?
# Returns the value most recently written at or before that timestamp.
snap = store.get_snapshot(
    entity_id=1234,
    feature_names=["risk_score", "amount"],
    as_of=datetime(2025, 11, 1, tzinfo=timezone.utc),
)
print("Snapshot:", snap)

# Two-point diff: what changed between last week and today?
now_ts_us       = int(time.time() * 1e6)                 # microsecond timestamps
last_week_ts_us = now_ts_us - 7 * 24 * 3600 * 1_000_000
delta = store.diff(
    entity_id=1234,
    feature_names=["risk_score", "amount"],
    t1=last_week_ts_us,
    t2=now_ts_us,
)
# -> {"risk_score": (0.41, 0.82), "amount": (1200, 5000)}   # (value_at_t1, value_at_t2)
EOF
7. Verify
# Smoke test (server must be running)
source sdk/python/.venv/bin/activate
python smoke_test.py
8. Seed demo data and open the Replay Console
# Seed the fraud incident demo (one-time)
python console/live_feed_fraud.py --demo

# Launch the Replay Console
pip install -r console/requirements.txt   # first time only
streamlit run console/app.py
# -> http://localhost:8501
Add decision recording (the @record decorator writes features and audit trail in one call), set up drift monitoring against your training distribution, or extract point-in-time correct training data. See the guides in the sidebar.
Installation
ARA ships as a single self-contained binary. No runtime dependencies. No package manager required. The client SDKs install separately from the public registries, or straight from the release bundle.
Follow along - the complete install, including all three activation steps, in one minute:
Install the SDKs
Python (requires Python 3.12 or newer - the SDK uses the CPython 3.12 stable ABI):
# From PyPI (recommended)
pip install ara-labs-sdk

# Pin the version in production
pip install ara-labs-sdk==1.0.1

# Or use the copy bundled in the release tarball
# (./install.sh creates sdk/python/.venv with it preinstalled)
Java (requires Java 21 or newer) - resolves from Maven Central as a single self-contained artifact with no transitive dependencies:
# Maven
<dependency>
    <groupId>ai.aralabs</groupId>
    <artifactId>ara-java-sdk</artifactId>
    <version>1.0.1</version>
</dependency>

# Gradle
implementation "ai.aralabs:ara-java-sdk:1.0.1"

# Or add the bundled jar (sdk/java/ in the release tarball) to your classpath
The SDKs are protocol clients: they are freely redistributable and do nothing without a running, licensed ARA server. Keep the SDK and server on the same minor version; the server logs a warning on mismatch.
Supported platforms
- Linux x86_64 (native binary)
- Linux ARM64 / aarch64 (Graviton etc.): rolling out - check the download page platform picker
- macOS (Apple silicon): no native build yet - use the Docker path below
Apple silicon & ARM hosts via Docker
Prefer the native Linux ARM64 tarball on ARM hosts - it ships on the download page and runs natively in arm64 containers (Docker on Apple silicon defaults to arm64) and on Graviton/Ampere, with no emulation. If you download a tarball into a container, match the architecture: uname -m inside the container tells you which build you need.
The pre-built ARA Docker image is a separate path and is currently published for linux/amd64 only. On Apple-silicon Macs, Docker Desktop runs it transparently under Rosetta 2 - fine for evaluation and development (expect some throughput loss vs native; don't benchmark this configuration).
# The registry is gated - log in first with your machine token
# (issued on the activation page); the username is your license email:
docker login registry.aralabs.ai

# Apple silicon / any ARM64 host with emulation available.
# --cores 2 → the server listens on 50051 and 50052, so map both:
# IMPORTANT: pin a stable machine identity. Activation binds the license
# to the container's hostname and /etc/machine-id - without these two flags,
# recreating the container produces a "new machine" and the activation
# lockfile is rejected on startup.
echo "$(uuidgen | tr -d -)" > ara-machine-id   # generate once, keep the file

docker run -d --name ara-server --platform linux/amd64 \
  --hostname ara-server \
  -v "$(pwd)/ara-machine-id:/etc/machine-id:ro" \
  --ulimit nofile=65536:65536 \
  -p 50051-50052:50051-50052 -v ara-data:/data \
  registry.aralabs.ai/ara-server:community --cores 2
To move the license to a different container host later, use the standard deactivate-then-reactivate flow on the activation page.
Publish the same consecutive port range as the worker count you pass: --cores N uses 50051 … 50051+N-1. On ARM64 Linux without Rosetta (e.g. Graviton), skip image emulation entirely - use the native Linux ARM64 tarball from the download page instead.
Minimum requirements
- 2 vCPU, 2 GB RAM (single-node community)
- NVMe storage strongly recommended for lowest latency
- Linux kernel 5.4+ (for io_uring support)
- Python 3.12+ for the Python SDK and Replay Console; Java 21+ for the Java SDK
Troubleshooting first runs
The seven issues that account for nearly all first-run friction:
uname -m where ARA runs and download the matching build (x86_64 or aarch64). The common case: Docker on an Apple-silicon Mac runs arm64 containers by default, so use the Linux ARM64 build there - it runs natively, no emulation. install.sh detects this and names the right download../install.sh.~/.ara/activation.lock and activate the new build with a fresh token./etc/machine-id changed, so it looks like a new machine. Pin both (see the Docker section above), or deactivate and reactivate.--port N to move the base port; the SDKs take base_port= / .basePort() to match.register_features() once (see API reference, step 2).Still stuck? GitHub Issues - best-effort, usually within 24-48h.
Systemd service
# /etc/systemd/system/ara.service
[Unit]
Description=ARA Decision Data Plane
After=network.target

[Service]
User=ara
WorkingDirectory=/opt/ara
ExecStart=/opt/ara/bin/ara-start.sh
Restart=always
RestartSec=5

[Install]
WantedBy=multi-user.target
Core concepts
ARA is the decision data plane: one temporally ordered record of every entity, every feature, and every decision your AI systems produce, captured at the moment of inference. Your systems write each decision once; every later question - what did the model see, why did it decide, what changed, who else was affected - becomes a query against that record. Five terms carry the whole mental model:
Entity
An entity is any object that makes or is subject to AI decisions: a user, an applicant, a transaction, an agent. ARA maintains a complete, temporally ordered history of every entity across every inference event. Entities are identified by a unique 64-bit integer ID. ARA does not manage string identifiers - your application is responsible for assigning each entity a stable, unique integer and maintaining that mapping. See the SDK reference → Entity IDs for details.
Decision
A decision is a single inference event: one entity, one model, one feature vector, one output, one timestamp. ARA persists a complete snapshot of the entity's state at the moment the decision was made. This snapshot is immutable, nothing in it changes after it is written.
Snapshot
A snapshot is ARA's internal unit of storage. It contains the full feature vector, the model version (name + SHA), the decision output, the entity's accumulated state history up to that point, a microsecond-precision timestamp, and a SHA-256 chain hash linking it to the prior snapshot for the same entity.
Terminology note: you will also meet get_snapshot() in the API - that is the read that returns an entity's state as of a moment in time. Same word, two sides of the same coin: the storage unit is what the read reassembles.
Replay
Replay reconstructs a past decision exactly, same entity state, same features, same model context. It does not re-run the model. It retrieves the original snapshot and returns it. The chain_valid field in the response confirms that the chain of custody is intact from the original write to the current retrieval.
Decision chain
Each entity's snapshots form a cryptographic chain. Every snapshot includes a SHA-256 hash of the prior snapshot. If any historical record is modified, the chain breaks - detectable via the SDK's chain validation method.
Where to go next
Evaluating ARA? Read the fraud case study for the end-to-end story, then skim the Replay Console page and watch its video.
Integrating it? Installation gets the server and SDKs onto your machine; Quickstart takes you from zero to a replayed decision in under ten minutes; the API reference follows the exact call order.
Operating it? Configuration and Monitoring cover flags, systemd, and the Grafana stack.
Here for compliance? The compliance guide maps the decision record to EU AI Act Article 13, SR 11-7, and DORA.
SDK reference
ARA uses a high-performance binary protocol (FlatBuffers over TCP). The Python and Java SDKs in the release bundle handle all protocol details. Base ports: 50051-50055 (one port per worker, configurable via --port and --cores).
The reference below follows that call order. The one hard rule: features must be registered before the first write or read that uses them - everything else can happen in any order.
Before you start: entity IDs
ARA stores data against 64-bit integer entity IDs. Every entity must have a unique integer ID - no two distinct real-world entities should share the same integer. ARA does not store or manage string identifiers; your application is responsible for assigning and maintaining a stable, unique integer for each entity.
The simplest approach is to use your existing integer primary keys (e.g. database row IDs) directly:
user_eid  = 1234      # your database user.id - already unique
order_eid = 99812     # your database order.id - already unique
If your entities are only identified by string keys, allocate a unique integer for each one when it is first seen and persist that mapping (e.g. in a database lookup table) so the same integer is returned on every subsequent access:
# Pseudocode - implement using your own persistent store
def get_or_create_entity_id(natural_key: str) -> int:
    eid = db.lookup(natural_key)           # check your mapping table
    if eid is None:
        eid = db.next_sequence_value()     # allocate a new unique integer
        db.insert(natural_key, eid)        # persist the mapping
    return eid

user_eid  = get_or_create_entity_id("user:1234")
order_eid = get_or_create_entity_id("order:abc99")
1 · Connect
from ara_store import ARAStore, FeatureSpec

store = ARAStore()  # localhost:50051, auto-discovers the server's partition count
# Explicit form: ARAStore(host="ara.internal", base_port=50051)
# Pass num_partitions= only when connecting before the server is up.
import com.ara.sdk.ARAStore;
import com.ara.sdk.ARAConfig;
import com.ara.sdk.FeatureSpec;

ARAStore store = new ARAStore();  // localhost:50051, auto-discovers partition count
// Explicit form - setting numPartitions pins the layout (skips discovery):
ARAStore store2 = new ARAStore(ARAConfig.builder()
    .host("ara.internal").basePort(50051).build());
2 · Register features - once, before writes or reads
Registration is a one-time schema operation per feature, not a per-write step. The call blocks until the registry is readable everywhere (read-your-writes), so code on other machines and in other languages can use the features immediately after it returns. Registering the same features again is a harmless no-op; add new features any time with the same call.
store.register_features([
    FeatureSpec(name="amount"),
    FeatureSpec(name="risk_score"),
])
store.registerFeatures(List.of(
    FeatureSpec.builder("amount").build(),
    FeatureSpec.builder("risk_score").expectedRange(0.0, 1.0).build()
), true);   // merge=true: accumulate with previously registered specs
3 · Write
# Write feature values; the serving model version travels as a
# parameter (recorded in the model registry), not as a feature.
store.write(entity_id=ENTITY_ID, features={
    "amount": 5000,
    "risk_score": 0.82,
}, model_version="fraud-v3")
// Model version travels as a parameter, not as a feature
long nowUs = System.currentTimeMillis() * 1_000L;
store.write(ENTITY_ID, Map.of(
    "amount", 5000L,
    "risk_score", 0.82
), nowUs, "fraud-v3");

// Batch write - each record carries its "entityId" key
store.writeBatch(List.of(
    Map.of("entityId", 1L, "risk_score", 0.9),
    Map.of("entityId", 2L, "risk_score", 0.4)
));
4 · Read - latest, point-in-time, history, batch
# Latest values
snap = store.get_latest(entity_id=ENTITY_ID,
                        feature_names=["amount", "risk_score"])
print(snap)  # {"amount": 5000, "risk_score": 0.82}

# Point-in-time snapshot (time-travel) - as_of accepts a datetime or microsecond int
from datetime import datetime, timezone
snap_at = store.get_snapshot(entity_id=ENTITY_ID,
    feature_names=["risk_score", "amount"],
    as_of=datetime(2025, 11, 1, tzinfo=timezone.utc))

# Full value history for a single feature
history = store.get_feature_history(entity_id=ENTITY_ID, feature_name="risk_score")
for ts_us, value in history:
    print(ts_us, value)
// Latest values
Map<String, Object> latest = store.getLatest(ENTITY_ID,
    List.of("amount", "risk_score"));

// Point-in-time snapshot (time-travel) - microsecond timestamp
long asOfUs = Instant.parse("2025-11-01T00:00:00Z").toEpochMilli() * 1_000L;
Map<String, Object> snapAt = store.getSnapshot(ENTITY_ID,
    List.of("risk_score", "amount"), asOfUs);

// Before/after between two moments - each value is Object[]{atT1, atT2}
Map<String, Object[]> delta = store.diff(ENTITY_ID,
    List.of("risk_score"), t1Us, t2Us);
// Per-feature value history: not yet exposed in the Java SDK (roadmap)
Batch reads
# One fan-out, many entities - same point-in-time semantics as get_snapshot
snaps = store.get_snapshot_batch(
    entity_ids=[1001, 1002, 1003],
    feature_names=["risk_score", "amount"],
    as_of=some_ts_us,          # datetime or microsecond int; None = latest
)
# -> {1001: {"risk_score": 0.12, ...}, 1002: {...}, 1003: {...}}
// One fan-out, many entities - same point-in-time semantics as getSnapshot
Map<Long, Map<String, Object>> snaps = store.getSnapshotBatch(
    List.of(1001L, 1002L, 1003L),
    List.of("risk_score", "amount"),
    asOfUs);
5 · Record decisions
One call binds the decision output to the entity, its features, and the serving model version - the record everything downstream queries. Full patterns (including the zero-touch @record decorator) are in the Record decisions guide.
store.record_decision("req-uuid-8a3f", entity_id=ENTITY_ID,
    output={"bid_score": 0.77}, model_version="fraud-v3",
    metadata={"campaign_id": "camp-42"})
store.recordDecision("req-uuid-8a3f", ENTITY_ID,
    Map.of("bid_score", 0.77),          // output
    null,                               // timestampUs (null = now)
    "fraud-v3",
    Map.of("campaign_id", "camp-42"),   // metadata
    null);                              // extra features, written atomically

DecisionRecord rec = store.getDecision("req-uuid-8a3f", null);
6 · Investigate - model versions over time
When features are written with model_version=, the serving version becomes queryable at any point in time - the backbone of the Replay Console's deployment markers.
# Which model served this entity at that moment?
# -> "fraud-v3", or None if no version was ever written
mv = store.get_model_version(entity_id=1234, as_of=decision_ts_us)

# Version transitions over a window (sampled; lower step_us = finer)
timeline = store.get_transform_history(
    entity_id=1234, since=t_start, until=t_end,
    step_us=60 * 1_000_000)   # 1-minute sampling
# -> [(ts_us, "fraud-v2"), (ts_us, "fraud-v3"), ...]  (transition points only)
// Which model served this entity at that moment? null if never written
String mv = store.getModelVersion(1234L, decisionTsUs);

// Version transitions over a window (sampled; lower stepUs = finer)
List<Object[]> timeline = store.getTransformHistory(
    1234L, tStartUs, tEndUs, 60_000_000L);   // 1-minute sampling
// -> each element: {tsUs, "fraud-v3"} (transition points only)
Feature lineage
Register how derived features are computed from sources; then query impact in either direction - "what feeds this feature" for debugging, "what depends on it" before changing a pipeline.
store.register_lineage({
    "risk_score": {"upstream": ["txn_velocity_1h", "account_age_days"],
                    "transform": "fraud_features.py::compute_risk"},
})

store.get_upstream_features("risk_score")     # transitive sources
store.get_downstream_features("txn_velocity_1h")  # impact analysis
store.get_lineage(as_of=last_month_ts)        # the DAG as it was then
// Query the registered lineage graph (register via the Python SDK or config)
List<String> sources = store.getUpstreamFeatures("risk_score", null);
List<String> impact  = store.getDownstreamFeatures("txn_velocity_1h", null);
LineageDAG dag = store.getLineage(lastMonthUs);  // the DAG as it was then
Outcome labels
# All label-write events for an entity in a window (e.g. chargebacks)
events = store.scan_labels(entity_id=1234,
    label_names=["chargeback", "converted"], since=t_start, until=t_end)
# -> [(ts_us, {"chargeback": 1.0}), ...]
// All label-write events for an entity in a window (note the sampling stepUs)
List<Object[]> events = store.scanLabels(1234L,
    List.of("chargeback", "converted"), tStartUs, tEndUs, 60_000_000L);
// -> each element: {tsUs, Map.of("chargeback", 1.0)}
7 · Govern - erasure and retention
forget_entity() implements right-to-erasure (GDPR Art. 17): all reads for the entity are suppressed server-side. Retention sets the global history horizon.
# Right-to-erasure: suppress every read for this entity
store.forget_entity(entity_id=1234)

# Global retention policy (days of history to keep; 0 = unlimited)
store.set_retention(days=365)
store.get_retention()   # -> 365
// Erasure and retention are Python SDK / server-side operations today:
//   store.forget_entity(entity_id)  ·  store.set_retention(days)
// Java SDK parity for these calls is on the roadmap.
Java SDK setup
Every step above shows its Java form under the language tab - the call order is identical, and the two SDKs are fully interoperable against the same server (a Java write is immediately readable from Python, and vice versa). The artifact resolves from Maven Central, self-contained with no transitive dependencies. If you are pinned to version 1.0.0, add <classifier>all</classifier>; 1.0.1 and later need no classifier.
# Maven
<dependency>
    <groupId>ai.aralabs</groupId>
    <artifactId>ara-java-sdk</artifactId>
    <version>1.0.1</version>
</dependency>

# Gradle
implementation "ai.aralabs:ara-java-sdk:1.0.1"

# Or add the jar from the release bundle directly to your classpath
javac -cp ara-java-sdk-all.jar MyApp.java
Requires Java 21+. Remember store.close() when done - the store owns a connection pool. Not yet in the Java SDK (roadmap): per-feature value history, entity decision scans, erasure/retention calls.
Replay Console
The Replay Console is a browser UI (Streamlit) that connects live to a running ARA server. It lets you inspect any entity's full feature history, replay past decisions, detect drift, investigate blast radius, and compare entities - without writing any code. It is useful for debugging, incident investigation, and compliance reviews.
Video walkthrough
Watch a live fraud incident unfold and get root-caused end to end - timeline replay, pinned diffs, forensic drift, blast radius, entity compare, co-movement, and point-in-time snapshots - in six and a half minutes:
Requirements
The server must already be running. The Replay Console is included in the release bundle under console/.
# Install dependencies (one-time)
pip install -r console/requirements.txt

# Seed the fraud incident demo (optional, good for first-time exploration)
python console/live_feed_fraud.py --demo

# Launch
streamlit run console/app.py
# → opens at http://localhost:8501
Sidebar controls
The sidebar persists across all tabs. Set these before running any query:
- Connection - host and base port of your server. Leave Partitions at
0to auto-discover the server's partition count (recommended). Click Reconnect after changing. - Entity ID - the integer entity ID to inspect. All tabs operate on this entity.
- Date / time window - the UTC date and from/to time range for the query.
- Features - newline-separated feature names to include. Enter the features you want to inspect.
- ▶ Run replay - executes the query and populates all tabs.
Tabs
📈 Timeline
Plots each selected feature as a time series over the chosen window. Model version changes are marked as vertical dashed lines on the chart. The tab has two modes: Replay (fetches history on demand) and Live (auto-refreshes every 5 seconds). Click any point on the chart to set pin ① or pin ②; these pins are used by the Diff tab to compare two moments in time.
📉 Forensic Drift
Runs a 4-layer drift detector over the entity's history: z-score normalisation, CUSUM accumulation, lag-1 autocorrelation, and a composite weighted score. The primary display is per-feature out-of-range (OOR) violation cards showing count, percentage, and the exact timestamp of the first violation. Stage labels - Stable / Warning / Drift / Regime failure - are shown on the CUSUM drift score chart. Training stats for z-score normalisation are sourced from the server via store.get_training_stats(), falling back to an auto-baseline from the earliest 25% of the window if not registered. Use this tab to identify when and which features started drifting before using Diff to quantify the shift.
🔀 Diff
Compares the entity's feature values at two pinned points in time. To use Diff, first run a Timeline replay and click two points on the chart to set pin ① and pin ②. The Diff tab then shows a table of what changed, by how much, and whether either value was out of expected range - and renders a root-cause verdict banner (e.g. feature pipeline issue, model version change, sustained drift, or rollback detected). Has an Export Incident Report button that generates a structured Markdown postmortem. Equivalent to calling store.diff(entity_id, feature_names, t1, t2).
📸 Snapshot
Returns the exact feature values for the entity at a specific microsecond timestamp - the same result as store.get_snapshot(entity_id, feature_names, as_of=ts). Includes a preset selector populated from your schema phases. Use this to reproduce precisely what the model saw at the moment of a particular decision.
✏️ Write
Write feature values directly to the server from the UI. Useful for testing and demos. Supports two modes: single entity write (enter multiple name = value pairs, one per line, with an optional model version and timestamp) and bulk write (paste a CSV with an entity_id column and one column per feature). Equivalent to store.write() and store.write_batch() respectively.
🔬 Investigate
Advanced diagnostic tools with four sub-tabs. Requires a Timeline replay to have been run first.
- First anomaly - scans the write history between pins ① and ② to find the exact microsecond any feature first crossed its expected range boundary. Falls back to binary search (configurable bisection depth) if the history primitive is unavailable.
- Blast radius - samples up to 100 entities from the fleet at pin ②, checks each for OOR or z≥3σ anomaly, and reports a fleet-wide impact verdict: Fleet-wide incident (≥50% affected), Partial blast radius (≥10%), or Isolated (<10%).
- Entity compare - side-by-side snapshot of two entities at the same timestamp, with a delta column and anomaly flags for features out of range in entity A only.
- Co-movement - builds a correlation matrix over the Timeline window and groups features that moved together above a configurable threshold (default 0.8). Useful for identifying which correlated features a single pipeline fix will resolve.
Pipeline health monitor
The release bundle also includes console/ara_monitor.py - a standalone script that runs alongside the console in production. It polls the server every N seconds, counts OOR writes per feature across your entity fleet, and exposes Prometheus metrics on :9092/metrics (ara_oor_rate, ara_oor_count, ara_oor_entities, ara_oor_alarm). When the OOR rate exceeds the alarm threshold for two consecutive polls, it fires a Slack webhook alert containing a deep link that opens the Replay Console directly at the affected entity and time window.
# Run the monitor alongside the console
python console/ara_monitor.py \
  --host localhost --port 50051 --partitions 5 \
  --entities 0-999 --features risk_score,click_rate \
  --interval 30 --slack-webhook https://hooks.slack.com/... \
  --console-url http://localhost:8501
Typical workflows
Debugging a bad model decision: enter the entity ID, set the time window around when the decision was made, run the Timeline to see what each feature looked like, then use Snapshot at the exact decision timestamp to confirm the feature vector the model received.
Investigating a drift alert: open Forensic Drift to see which features have OOR violations and when the first one occurred. Pin the before and after moments on the Timeline, then switch to Diff to get the root-cause verdict and export an incident report.
Compliance review: use Snapshot with the timestamp from a specific decision to produce a point-in-time record of the feature values used. This is the same data the SDK returns - the UI is a human-readable front-end over the same server APIs.
Configuration
ARA is configured via command-line flags or environment variables. The most common options:
# Start with explicit options
./bin/ara-start.sh --cores 4 --port 50051 --data-dir /var/lib/ara

# Key flags
# --cores N         number of worker threads (default: auto-detect)
# --port N          base port (workers listen on N, N+1, … N+cores-1)
# --data-dir PATH     data directory (default: ./data relative to binary)
# --activate TOKEN    one-time activation on first run
# --license-file PATH extended license (omit to run on Community defaults)
# --startup-horizon N index only the newest N sealed chunks hot (see below)
# --max-history N     cap retained history depth per entity-feature pair

# Key environment variables
# ARA_DATA_DIR        overrides --data-dir
# ARA_LICENSE_FILE    overrides --license-file
Memory, restarts, and the startup horizon
ARA serves reads from an in-memory temporal index. By default the server indexes all stored history at startup - the right choice while a store is young, and a tunable one as it grows. --startup-horizon N is that tunable: the newest N sealed chunks (roughly 64 MB of writes each, per partition) stay hot, while everything older remains fully queryable and is resolved on demand - a small one-off cost on first access, typically milliseconds.
Nothing is deleted: the horizon changes where history is indexed, not whether it exists - time travel still spans the entire retained store. Size N so the hot window covers what your serving reads touch (commonly the last 30-90 days) and let audits and deep replays go cold. To actually cap what is retained, use --max-history or the retention API - those discard data; the horizon does not. History grows forever; memory and restart time don't have to.
Compliance guide
This guide explains how ARA's architecture maps to the specific requirements of EU AI Act Article 13, SR 11-7, and DORA.
EU AI Act, Article 13
Article 13 requires that high-risk AI systems be transparent enough for deployers to interpret outputs. The ARA decision record provides: the complete input feature vector at decision time, the exact model version, the entity's accumulated state history, and a cryptographically verified chain of custody.
Structured Article 13 transparency-report exports (PDF and JSON) are planned for the Enterprise edition, with scope driven by design-partner requirements. Today, every element a report needs - inputs, model version, timestamps, chain of custody - is already captured in the decision record and retrievable via the SDK; see the API reference.
SR 11-7, Model risk management
SR 11-7 requires that model outputs be explainable and that the data used to produce them be documented. ARA's snapshot record satisfies the documentation requirement: every decision includes the exact data the model received, not a post-hoc reconstruction.
DORA, Digital resilience
DORA Article 9 requires that AI systems be testable and recoverable. ARA's replay capability is a direct implementation of this: any past decision can be reconstructed exactly, enabling post-incident analysis, regression testing against historical data, and demonstration of recovery capability to auditors.
Right to erasure
GDPR Article 17 requests are one call: store.forget_entity(entity_id) suppresses all reads for that entity server-side. See API reference → Data governance.
Exporting audit records
Use the Python SDK to export a full decision history for an entity:
from ara_store import ARAStore, FeatureSpec
import json

store = ARAStore()  # auto-discovers the server's partition count

# Export full value history for a feature on one entity
# entity_id must be an integer
ENTITY_ID = 1234
history = store.get_feature_history(
    entity_id=ENTITY_ID,
    feature_name="risk_score",
)
with open("user_1234_risk_score_history.json", "w") as f:
    json.dump([(ts, val) for ts, val in history], f, indent=2)

# Export schema-level audit trail (all register_features calls)
from datetime import datetime, timedelta
log = store.get_audit_log(
    # Community (website-issued licenses): 30-day history window.
    # Enterprise: unlimited.
    since=datetime.now() - timedelta(days=30),
)
for event in log:
    print(event.timestamp_us, event.operation, event.actor)
Activation
ARA Community Edition uses machine-based activation. Each binary is tied to the machine it runs on. Activation is a one-time step per machine - no internet required after the first activation.
How it works
# 1. Run the server once - it prints an activation code and exits:
./bin/ara-start.sh
# Output: Activation required. Your code: ARA-XXXXXXXX-XXXXXXXX-XXXXXXXX-XXXXXXXX
# Visit https://aralabs.ai/activate to exchange this code for a token.

# 2. The activate page also shows your signed license key - install it
#    (unlocks your issued entitlements, e.g. the 30-day history window;
#    without it the server runs on baseline community defaults):
mkdir -p ~/.ara && printf '%s' 'ara_lic_...' > ~/.ara/license.key

# 3. Run with your token (one time):
./bin/ara-start.sh --activate YOUR_TOKEN

# 4. All subsequent starts work without the flag:
./bin/ara-start.sh
The activation token is stored in ~/.ara/activation.lock. Deleting it requires re-activation. Override the path with ARA_ACTIVATION_LOCK_FILE. The license key is loaded automatically from ~/.ara/license.key (or set ARA_LICENSE_FILE / ARA_LICENSE_KEY explicitly - useful for containers).
Activation scope
- One activation per machine (tied to
/etc/machine-idon Linux) - No expiry - activation does not time out
- Works fully offline after the initial activation step
A container's machine identity changes every time it is recreated, which invalidates activation. Pin a stable identity in your compose file - set hostname: and bind-mount a fixed machine-id file - and keep ~/.ara on a named volume so the activation lock and license key persist:
services:
  ara:
    hostname: ara-prod-1                    # stable across recreates
    volumes:
      - ./machine-id:/etc/machine-id:ro    # e.g. `uuidgen | tr -d - > machine-id`
      - ara-home:/root/.ara                # activation.lock + license.key
Moving to a new machine (self-serve, no support ticket)
Your license is bound to one machine at a time, but migration is entirely self-serve - recycled VMs, hardware upgrades, and moving from staging to production are expected, not penalized.
# 1. Run the server on the NEW machine - it prints a fresh activation code:
./bin/ara-start.sh
# Output: Activation required. Your code: ARA-XXXXXXXX-...

# 2. Submit that code at https://aralabs.ai/activate
#    If the license is still active on the old machine, the page tells you
#    so and offers a one-click "Deactivate previous machine" - no support
#    ticket, no waiting. Deactivate, then submit the new code again.

# 3. Activate the new machine:
./bin/ara-start.sh --activate YOUR_NEW_TOKEN
If the old machine is already gone (terminated VM, dead disk), the same flow works - deactivation does not require access to the old machine.
Enterprise licenses
Enterprise licenses are issued as part of the contract process and include a feature flag payload that unlocks HA replication, RBAC, SSO, and compliance tooling. Contact sales to discuss.
Record decisions
Every time your model makes a decision, record it. ARA stores the output, model version, and a timestamp. The feature values are already in the temporal store from the write that happened moments earlier - recovering them is a single get_snapshot() call at the decision's timestamp. Nothing is duplicated.
The @record decorator (Python)
Add @record to your scoring function. ARA writes the input features and output in one call at the exact microsecond the prediction runs. No extra code at each call site.
from ara_store import ARAStore, record

store = ARAStore()

@record(
    store=store,
    entity_col="user_id",       # argument holding the entity ID
    features_col="features",    # argument holding the feature dict
    output_feature="bid_score", # name to store the return value under
    model_version="v2.1",       # stored alongside every decision
    decision_id_col="request_id", # optional: indexes decisions by ID
)
def predict_bid(user_id: int, request_id: str, features: dict) -> float:
    """Your scoring function, unchanged."""
    return my_model.predict(features)

# Call it exactly as before. ARA writes features + score automatically.
score = predict_bid(
    user_id=42,
    request_id="req-uuid-8a3f",
    features={"risk_score": 0.08, "amount": 1420},
)
Direct record_decision() call
Use this when you cannot use the decorator - for example in Java, or when your scoring function is owned by another team.
# Python - call after write() and your model inference
store.record_decision(
    entity_id=42,
    decision_id="req-uuid-8a3f",   # use your existing request ID
    output={"bid_score": 0.73},
    model_version="v2.1",
    metadata={"campaign_id": "camp-99"},  # arbitrary context, optional
    # Do not pass features= here; they are already in the temporal store.
)
// Java - write features, run inference, then record
long tsUs = System.currentTimeMillis() * 1_000L;
store.write(42L, Map.of("risk_score", 0.08, "amount", 1420L), tsUs, "v2.1");
double score = myModel.predict(features);
store.write(42L, Map.of("bid_score", score), tsUs, "v2.1");
store.recordDecision("req-uuid-8a3f", 42L,
    Map.of("bid_score", score), tsUs,
    "v2.1", Map.of("campaign_id", "camp-99"), null);
Retrieve a past decision by ID
Six months later, an auditor asks about a specific decision. You retrieve the full context in one call.
rec = store.get_decision("req-uuid-8a3f")
print(rec.entity_id)       # 42
print(rec.timestamp_us)    # exact microsecond
print(rec.model_version)   # "v2.1"
print(rec.output)          # {"bid_score": 0.73}
print(rec.metadata)        # {"campaign_id": "camp-99"}

# Recover the exact features the model saw at that moment
features = store.get_snapshot(
    entity_id=rec.entity_id,
    feature_names=["risk_score", "amount"],
    as_of=rec.timestamp_us,
)
# -> {"risk_score": 0.08, "amount": 1420}
# These are the exact values the model received, not a reconstruction.
Scan all decisions for an entity in a time window
decisions = store.get_entity_decisions(
    entity_id=42,
    since=t_start,
    until=t_end,
)
The decision record contains the output, model version, and timestamp. Features are not duplicated - they are already in the temporal store from the preceding write() call. Recovering them is a get_snapshot() at the decision's timestamp. This avoids double-writing every feature value on every inference and keeps the temporal store as the single source of truth.
Drift & skew monitoring
ARA detects three distinct failure modes that degrade model accuracy in production. Each requires a different detection approach and has a different remediation path.
Step 0: register training statistics
Record your training distribution once after training. ARA keeps these on the server and uses them as the reference for all downstream monitoring.
from ara_store import ARAStore, FeatureStats

store = ARAStore()

store.register_training_stats({
    "risk_score": FeatureStats(mean=0.05, std=0.02, count=100_000),
    "amount":     FeatureStats(mean=1200,  std=300,  count=100_000),
    "session_len":FeatureStats(mean=8.0,   std=3.0,  count=100_000),
})
// Java
store.registerTrainingStats(Map.of(
    "risk_score", new FeatureStats(0.05, 0.02, 100_000),
    "amount",     new FeatureStats(1200, 300,  100_000),
    "session_len",new FeatureStats(8.0,  3.0,  100_000)
), false, null);
Distributional drift
The real-world distribution of a feature shifts over time. Example: user behaviour changes and risk_score drifts down across the board. Your model was calibrated at mean 0.05; now it is consistently seeing 0.02. Predictions degrade silently. Call compute_drift() alongside get_latest() at serving time to detect this.
drift = store.compute_drift(
    features={"risk_score": 0.02, "session_len": 6},
)
for feat, r in drift.items():
    if r.flagged:
        print(f"Drift alert: '{feat}' - score {r.drift_score:.2f}")
        # Action: schedule a retraining run
// Java
Map<String, DriftResult> drift = store.computeDrift(
    Map.of("risk_score", 0.02, "session_len", 6L), null, 0.6, 0.5, 5.0);
drift.forEach((feat, r) -> {
    if (r.cusumAlarm) System.out.println("Drift alert: " + feat);
});
Training-serving skew
A single feature value at serving time is far from where the training data was. This is different from drift: drift is a sustained population-level shift; skew is an individual value that looks wrong right now. A z-score above 3.0 (default threshold) typically indicates a pipeline bug - a unit conversion error, a null coerced to zero, or a field written to the wrong name.
skew = store.compute_skew(
    features={"amount": 47000.0},  # expected ~1200, std ~300
)
r = skew.get("amount")
if r and r.flagged:
    print(f"Skew alert: z-score {r.z_score:.1f} - check upstream pipeline")
    # z-score ~153: this value is implausible given the training distribution
// Java
Map<String, SkewResult> skew = store.computeSkew(
    Map.of("amount", 47000.0), null, 3.0);
SkewResult r = skew.get("amount");
if (r.flagged)
    System.out.printf("Skew alert: z=%.1f%n", r.zScore);
Temporal correlation monitoring
ARA tracks the temporal correlation between feature pairs as writes arrive. Register sentinel pairs whose structural relationship should remain stable over time. A sudden change in correlation - even if individual values look normal - can indicate a silent pipeline change such as a computation window switching from 7-day to 1-day, or a feature derivation logic update that affects how values move relative to each other.
store.register_sentinel_pairs([
    ("risk_score", "risk_score"),   # self-correlation: how sticky is this feature?
    ("amount",     "session_len"),  # cross-correlation: expected to move together
])

# Query at any time
corr = store.get_sentinel_correlation("risk_score", "risk_score")
print(f"Self-correlation: {corr:.3f}")
# A sudden drop from ~0.85 to ~0.05 suggests the computation window changed.
The Forensic Drift tab in the Replay Console visualizes all three failure modes for any entity over any time window, with per-feature OOR violation cards, CUSUM drift stage labels, and a root-cause verdict. See Replay Console →
Training data extraction
Training a new model requires a historical dataset: for each past event, you need the feature values the model would have seen at that moment alongside the eventual outcome. This is a point-in-time join. Getting it wrong is one of the most common sources of models that appear accurate in backtesting but degrade in production.
Why naive joins produce leaky training data
Suppose entity 1234 had a low risk score in November (risk_score = 0.02) and your system declined their application. In December they became much lower risk (risk_score = 0.82) and eventually converted.
If you run your training job today and join on entity ID alone, the November decision row gets risk_score = 0.82 - December's value, which didn't exist when the decision was made. Your model learns "low risk score → conversion," which looks correct. But at serving time, the November decision was made when risk_score was 0.02. The model learned from a feature value it never could have seen. Backtesting accuracy looks great; production accuracy collapses.
This is called label leakage. ARA eliminates it: every feature write is timestamped, and get_training_data() retrieves the value that existed at the exact timestamp of each decision - from the same temporal index used in production.
Record outcomes as features
Write outcome labels (conversions, approvals, etc.) as feature values with an explicit timestamp anchored to when the outcome occurred.
store.write_batch([
    {"entity_id": 1234, "converted": 1.0},
    {"entity_id": 5678, "converted": 0.0},
    {"entity_id": 9012, "converted": 0.0},
], timestamp=conversion_ts_us)
Point-in-time join (Python)
import pandas as pd
from ara_store import ARAStore

store = ARAStore()

# Labels DataFrame: entity ID + the timestamp of each past decision event
labels = pd.DataFrame({
    "entity_id":  [1234, 5678, 9012],
    "event_time": [nov_ts_us, nov_ts_us, dec_ts_us],
    "converted":  [1.0, 0.0, 0.0],
})

# ARA retrieves feature values at each row's exact event_time, not today's values
training_df = store.get_training_data(
    labels,
    feature_names=["risk_score", "amount", "session_len"],
    entity_col="entity_id",
    time_col="event_time",
    max_workers=8,  # parallelism for large label sets
)

# training_df is ready for scikit-learn / XGBoost:
# each row has the original label columns + point-in-time feature columns
X = training_df[["risk_score", "amount", "session_len"]]
y = training_df["converted"]
Point-in-time join (Java)
// Build label rows: each long[] is {entityId, eventTimestampUs}
List<long[]> labelRows = new ArrayList<>();
for (DecisionRecord dec : pastDecisions)
    labelRows.add(new long[]{dec.entityId, dec.timestampUs});

// Point-in-time join, 4 parallel workers
List<Map<String, Object>> rows = store.getTrainingData(
    labelRows,
    List.of("risk_score", "amount", "session_len"),
    4
);
// Each row: {"entityId": 1234, "risk_score": 0.02, ..., "eventTimeUs": ...}
Because ARA stores the full temporal history, the join is answered entirely from the server's in-memory index. Large label sets (millions of rows) are parallelized across workers. The same temporal index that serves production requests also serves your training pipeline.
Monitoring
ARA exports Prometheus metrics on port 9091. Two ready-to-use config files are included in the release bundle under monitoring/.
Metrics support varies by build: some release-candidate binaries ship a stub metrics service (the startup log prints Metrics service initialized with stub implementation and port 9091 does not listen). Verify with curl -s http://localhost:9091/metrics after starting the server - if it doesn't respond, your build does not include the metrics exporter and this page applies from the next build that does.
Start the metrics exporter
On Community Edition the server's native metrics endpoint is not enabled. The server emits its runtime counters as server_stats telemetry lines, and the bundled log-bridge exporter re-exports those same numbers in Prometheus format on port 9091. Nothing is synthesized: every value on the dashboard is read from the server's own telemetry.
# 1. Send telemetry to a file (or capture stdout with `> ara.log 2>&1`)
ARA_TELEMETRY_LOG_FILE=/var/log/ara-telemetry.log ./bin/ara-start.sh

# 2. Start the bundled exporter (Python 3 stdlib only, no dependencies)
python3 monitoring/exporter.py --log /var/log/ara-telemetry.log --port 9091
# verify: curl -s http://localhost:9091/metrics
Start Prometheus
# Linux: download from prometheus.io/download, or your package manager
prometheus --config.file=monitoring/prometheus.yml
# macOS: brew install prometheus
# -> http://localhost:9090
The provided monitoring/prometheus.yml scrapes localhost:9091 every 15 s. For a production deployment, replace localhost:9091 with your server's address. If you run multiple ARA instances, add each to targets.
The ARA dashboard
The bundled monitoring/ara-dashboard.json gives you a 15-panel view of a running server. Below: the dashboard live against a Community server on a 4-vCPU ARM box, sustaining bursts of ~30K writes/sec (each burst is one load session; ~1.1M operations total).
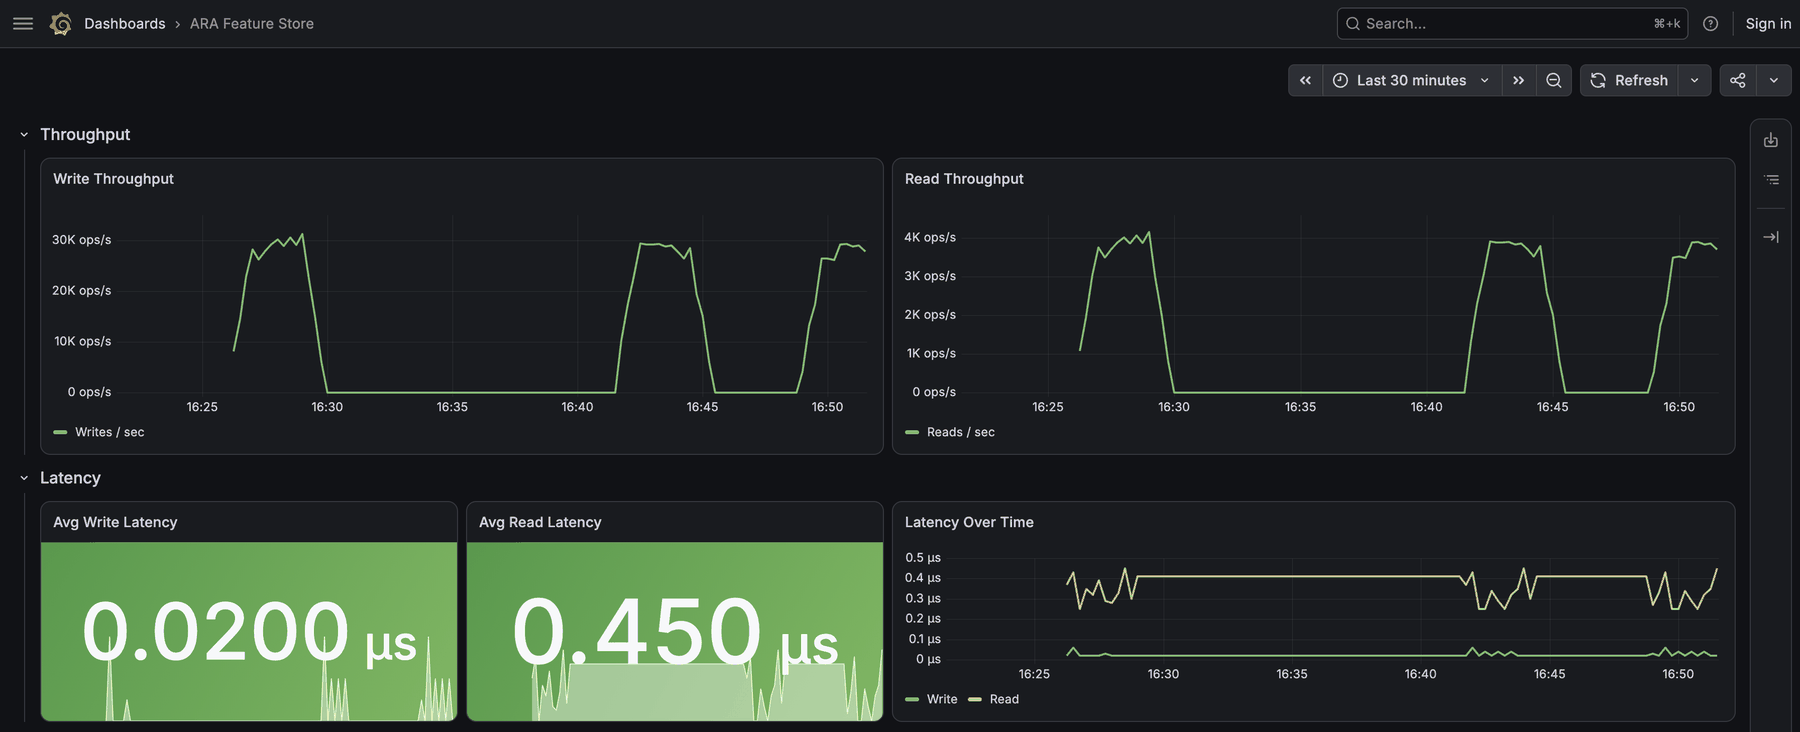
Throughput plots writes/sec and reads/sec from the operation counters - the shape you want to watch during a rollout or a load test. Latency shows the running average per operation: here 0.02 µs per write and ~0.45 µs per read against the in-memory temporal index (single node, no network hop included).
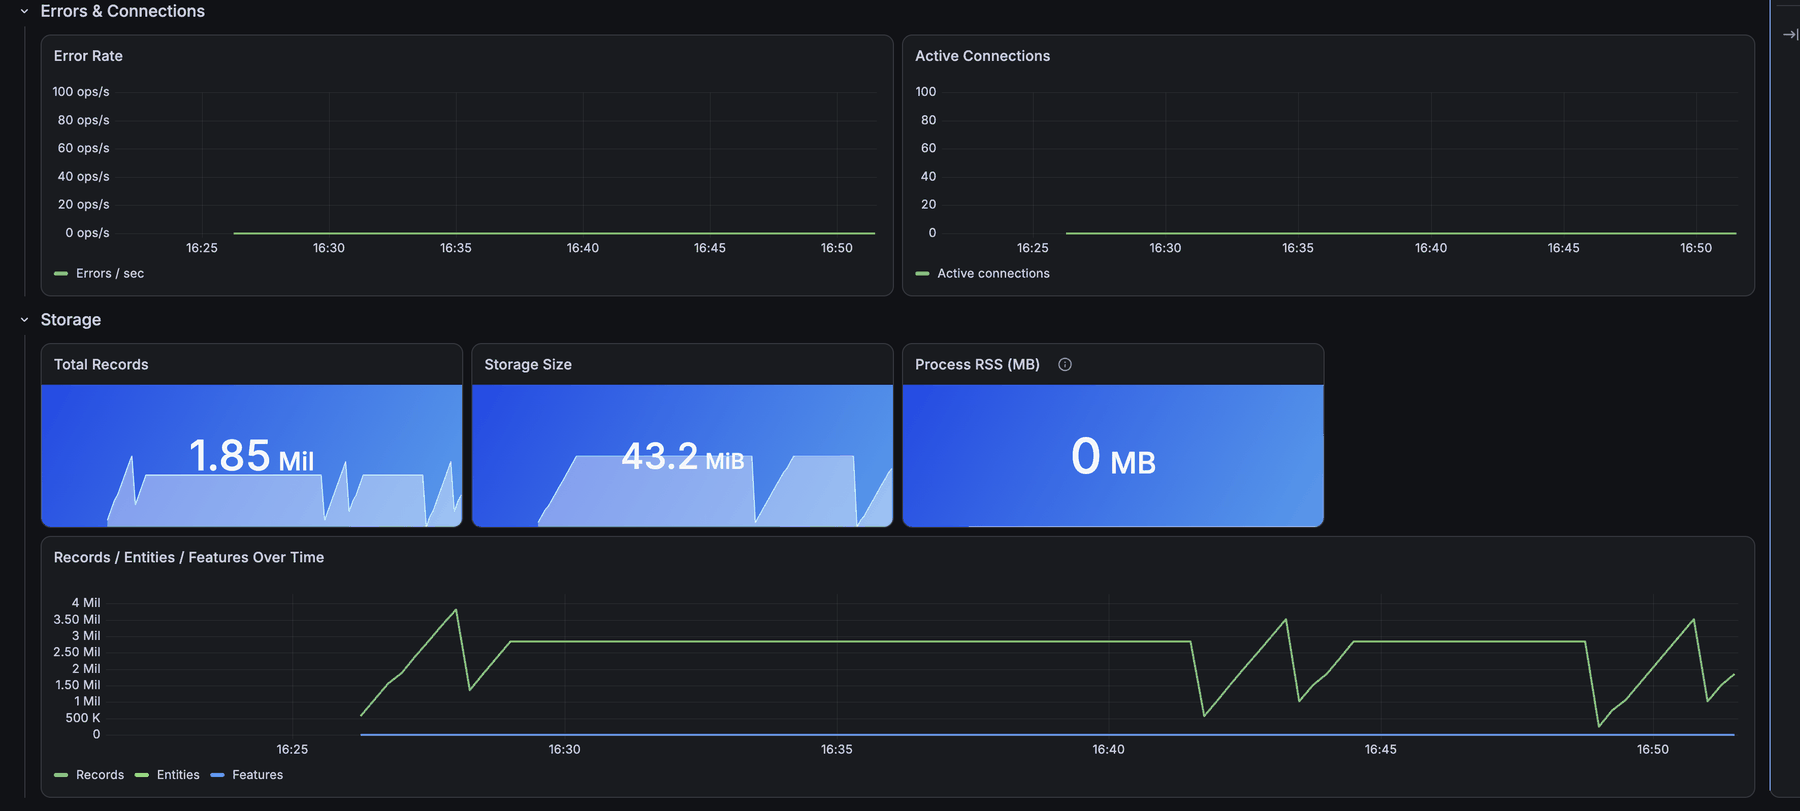
Errors & Connections should be flat at zero - any error rate at all warrants a look at SDK/server version match. Storage tracks total records and on-disk size; in Records over time you can see the server restarting between load sessions - each dip-and-recovery is the in-memory index rebuilding from sealed chunks on startup, which is also a useful visual health check that recovery works.
At scale
Same dashboard, same single node - under an Enterprise license, where community throughput quotas don't apply. This run was captured on an Apple-silicon (M-series) machine with five workers, driven by the Java SDK's throughput test client: write bursts peak above 1.2 million ops/sec, reads spike past 500K ops/sec, and the error panel stays flat at zero throughout.
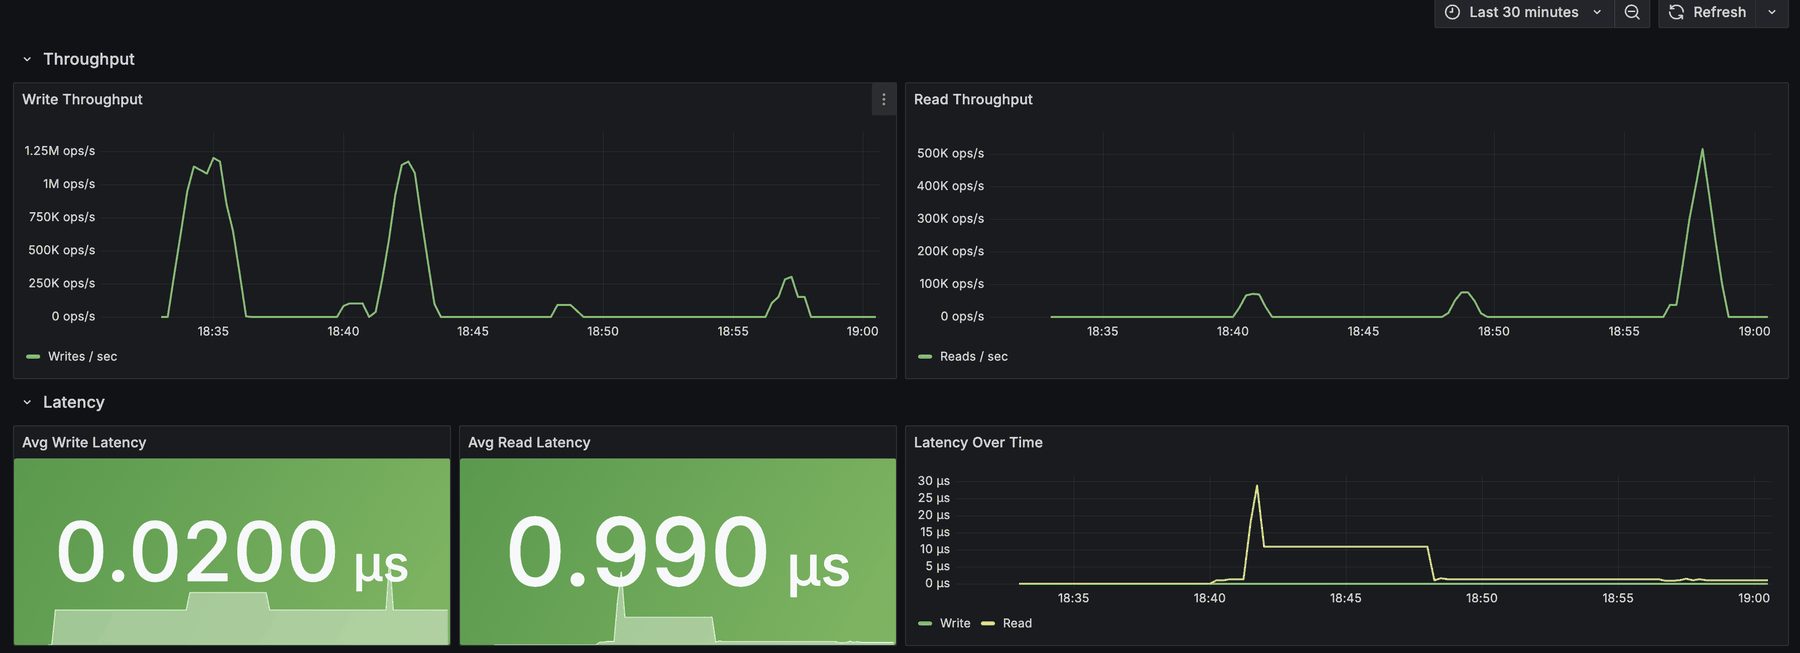
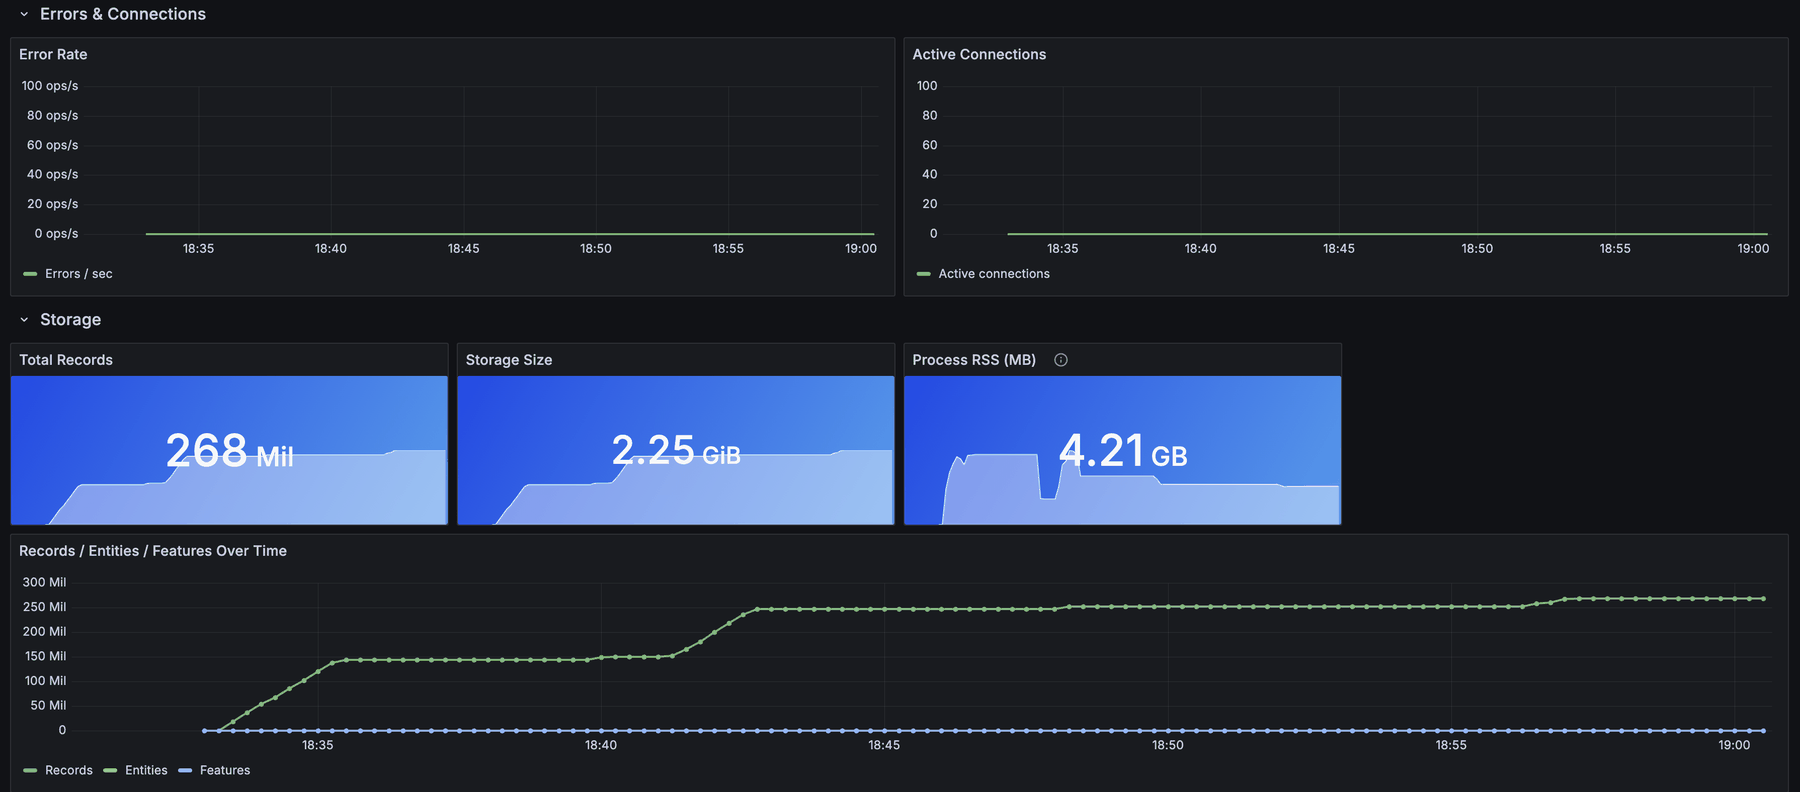
Two details worth reading off the panels: the node ingested 268 million records (2.25 GiB on disk) in about half an hour while Process RSS held around 4.2 GB - the in-memory temporal index staying proportionate to the data, not exploding with it. And during the heaviest write burst, average read latency briefly rose to ~27 µs before settling back under 1 µs - exactly the kind of transient the dashboard exists to make visible. One node behaves like this; sizing beyond that is a conversation with our team.
Import the Grafana dashboard
brew install grafana && brew services start grafana
# -> http://localhost:3000  (default login: admin / admin)
Add a Prometheus data source: Connections → Data sources → Add → Prometheus → URL http://localhost:9090 → Save & test. Then import the dashboard: Dashboards → Import → Upload JSON file → select monitoring/ara-dashboard.json → choose your Prometheus data source → Import. The 13-panel dashboard appears immediately and auto-refreshes every 10 s.
Key metrics
# Write and read throughput (ops/sec, 2-min window)
rate(feature_store_operations_total{operation="write"}[2m])
rate(feature_store_operations_total{operation="read"}[2m])

# Operation latency, microseconds (write / read) - gauge, query directly
feature_store_operation_latency_us{operation="write"}
feature_store_operation_latency_us{operation="read"}

# Error rate - any positive value warrants investigation
rate(feature_store_operations_total{operation="error"}[2m])

# Active connections
feature_store_system_metrics{resource="active_connections"}

# Stored volume: entities, features, records, and on-disk bytes
feature_store_storage_metrics{metric="total_entities"}
feature_store_storage_metrics{metric="total_features"}
feature_store_storage_metrics{metric="total_records"}
feature_store_storage_size_bytes{type="total"}

# Process memory (MB)
feature_store_process_rss_bytes{source="process_rss"} / 1048576
Signals to watch
- rejected counter > 0 - client is routing writes to the wrong worker. Usually an explicit
num_partitions=that doesn't match the server - constructARAStore()with no partition argument to auto-discover. - Write latency rising (
feature_store_operation_latency_us{operation="write"}) - server is CPU-bound or disk I/O is saturating. Add workers or move--data-dirto faster storage. - Error rate > 0 - deserialization failure or protocol mismatch. Confirm client SDK version matches server version.
- Active connections == 0 - connection pool dropped. Restart client; confirm server is running on expected ports.
- System pressure gauge > 0.5 - multiple stress signals coinciding. Check error types and latency panels together.
Check metrics directly
# All operation counters
curl -s http://localhost:9091/metrics | grep feature_store_operations_total

# Current write throughput (last 2-min window)
Q='rate(feature_store_operations_total{operation="write"}[2m])'
curl -sG http://localhost:9090/api/v1/query --data-urlencode "query=$Q" \
  | python3 -c "import sys,json; \
      r=json.load(sys.stdin)['data']['result']; \
      print(r[0]['value'][1] if r else 0)"
console/ara_monitor.py polls the server and exposes per-feature out-of-range (OOR) metrics on :9092/metrics. When OOR rate exceeds the alarm threshold for two consecutive polls, it fires a Slack webhook with a deep link into the Replay Console at the affected entity and time window. See the Replay Console docs for pipeline health monitor setup.
A fraud model that can answer for itself
Recording 200 scoring decisions, replaying one bit-for-bit, catching a bot attack with CUSUM, and extracting leakage-free training data - the complete loop, on a 4-vCPU ARM box, in about 120 lines of Python. Everything below was executed against a live ARA Community Edition server; the outputs shown are real.
The problem, concretely
Your fraud model blocks a transaction. Six weeks later a chargeback dispute, a regulator, or your own on-call engineer asks: why? In most serving stacks the honest answer is a reconstruction - you grep logs for the request, join them against a feature store that has since been overwritten with newer values, and produce a best guess of what the model probably saw. The gap between "probably saw" and "saw" is where disputes are lost and incident retros go circular.
The fix is architectural, not procedural: capture the (entity, features, decision, time) tuple at the moment of inference, in the same store that serves the features, so replay is a read - not a forensic project. That is the loop this walkthrough builds. The model itself is a stand-in (a monotone score over four features); the infrastructure neither knows nor cares whether the real thing is XGBoost, a GNN, or a rules engine.
Stage 1 - declare the schema
Features are grouped into inputs, outputs, and outcomes. The grouping isn't decorative: it drives the Replay Console's layout and lets drift monitoring distinguish "the world changed" (inputs) from "the model changed" (outputs) from "reality disagreed" (outcomes).
from ara_store import ARAStore, FeatureSpec, FeatureStats, record

store = ARAStore()   # auto-discovers the server's partition count

inputs  = dict(group="model_inputs",  group_label="Model inputs")
outputs = dict(group="model_outputs", group_label="Model outputs")

store.register_features([
    FeatureSpec(name="txn_amount",       **inputs),
    FeatureSpec(name="txn_velocity_1h",  **inputs),
    FeatureSpec(name="account_age_days", **inputs),
    FeatureSpec(name="geo_mismatch",     **inputs),
    FeatureSpec(name="fraud_score",      **outputs),
    FeatureSpec(name="blocked",          **outputs),
    FeatureSpec(name="chargeback",       group="outcomes", group_label="Outcomes"),
])
Note chargeback: it will stay empty for weeks. That is the point - outcomes arrive on a different clock than decisions, and the temporal index is what keeps them joinable without leakage (stage 6).
Stage 2 - record on the hot path
The scoring function gets one decorator. At the microsecond the prediction runs, ARA writes the input features, the returned score, and a decision index entry keyed by your request ID - one call site, no double bookkeeping between a feature logger and a decision logger.
@record(
    store=store,
    entity_col="account_id",     # int64 entity identifier
    features_col="features",
    output_feature="fraud_score",
    model_version="fraud-v3.2",
    decision_id_col="txn_id",    # your request UUID becomes the replay key
)
def score_txn(account_id: int, txn_id: str, features: dict) -> float:
    return model.predict(features)

for txn in incoming_stream:      # 200 transactions across 25 accounts in the test
    score_txn(account_id=txn.account,
              txn_id=txn.request_id,
              features=txn.features)
Two contract details worth knowing before you wire this into a real service. Entity IDs are 64-bit integers - the mapping from your string customer IDs is yours to own. And the decorator's default error mode is warn: a failed write logs rather than failing the transaction, which is what you want in a hot path, but it means you should watch the ara.record logger in production rather than assuming silence means success.
Stage 3 - replay one decision, exactly
Six weeks compressed into one assertion: pick decision #57 of the 200, fetch it by request ID, read back what the model saw at that exact microsecond, and recompute.
rec = store.get_decision("txn-f38ae06e-...")   # your request UUID
# rec.entity_id      -> 7000014
# rec.model_version  -> "fraud-v3.2"
# rec.timestamp_us   -> 1783429791266053
# rec.output         -> {"fraud_score": 0.4471}

seen = store.get_snapshot(
    entity_id=rec.entity_id,
    feature_names=["txn_amount", "txn_velocity_1h",
                   "account_age_days", "geo_mismatch", "fraud_score"],
    as_of=rec.timestamp_us,
)
recorded = seen.pop("fraud_score")
assert abs(model.predict(seen) - recorded) < 1e-6   # bit-identical
# live output:
3. exact replay OK - decision txn-f38ae06e… reproduces bit-identically
The assertion is stricter than it looks. It requires that the store returns the feature values as of the decision's timestamp even though those same features have been overwritten many times since (every account took multiple transactions), that the recorded output survives next to them, and that nothing was smoothed, deduplicated, or "latest-value"d along the way. If your current stack can pass this assertion for a decision made last quarter, you don't need this product. Most can't.
Stage 4 - catch the bot attack with CUSUM
Threshold alerts miss slow drifts; per-value z-score alerts drown you in noise. CUSUM accumulates evidence: each observation contributes its normalised deviation minus a slack k (default 0.5σ), and an alarm fires when the accumulator crosses h (default 5σ). Small sustained shifts accumulate to an alarm; one-off outliers decay.
First, register what "normal" looked like at training time. Transaction amounts are heavy-tailed, so declare them log-normal - the deviation is then computed in log space instead of pretending a $50k transfer is 76σ of Gaussian surprise:
store.register_training_stats({
    "txn_amount":      FeatureStats(mean=400.0, std=650.0, count=100_000,
                                    distribution_type="log_normal",
                                    log_mean=5.99, log_std=1.2),
    "txn_velocity_1h": FeatureStats(mean=2.1, std=1.8, count=100_000),
})
Then simulate the incident: a card-testing bot ramps one account to 15-40 transactions per hour with inflated amounts, and every write gets checked:
for txn in attack_burst:          # 300 shifted observations
    results = store.compute_drift({
        "txn_amount":      txn.amount,
        "txn_velocity_1h": float(txn.velocity),
    })
    if any(r.cusum_alarm for r in results.values()):
        alert(results)
# live output:
4. drift: 300/300 shifted writes raised a CUSUM alarm (PASS)
Because the shift was large, the accumulator crossed h almost immediately and stayed pinned - all 300 writes alarmed. A subtler drift (say, amounts creeping 0.3σ) alarms later but still alarms; that is the CUSUM trade you are opting into, and k/h are per-call parameters when your tolerance differs.
Stage 5 - triage with a temporal diff
The alarm names an account. The first triage question is always "what changed?" - answered here as a two-point diff over the attack window rather than a log spelunk:
delta = store.diff(entity_id=7_000_003,
                   feature_names=["txn_velocity_1h"],
                   t1=one_hour_ago_us, t2=now_us)
# {'txn_velocity_1h': (None, 8)}   ← no activity an hour ago; 8/hr now
Stage 6 - training data without label leakage
Weeks later the chargebacks arrive and you retrain. The classic failure: joining labels against current feature values, so the model trains on information from after the decisions it is supposed to learn from - offline AUC looks great, production doesn't. The fix is a point-in-time join against the same temporal index that served the decisions:
labels = pd.DataFrame({
    "entity_id":  account_ids,
    "event_time": decision_timestamps,   # µs or datetime
    "chargeback": outcomes,
})
df = store.get_training_data(
    labels,
    feature_names=["txn_amount", "txn_velocity_1h",
                   "account_age_days", "geo_mismatch", "fraud_score"],
)
# live output:
6. training extraction: 25 rows, 25 with features, point-in-time correct
Each row sees only what was written at or before its own event_time. The features your model trains on are, by construction, the features the production model saw - the same guarantee stage 3 asserted, applied in bulk.
What this adds up to
One decorator on the scoring function bought: an audit trail that answers "why" with data instead of reconstruction, an attack detector fed by the same writes that serve the model, incident triage as a query, and retraining data that cannot leak. No Kafka topic, no offline/online store pair to reconcile, no instrumentation layer - a single binary beside your serving path and a client SDK.
The full script is about 120 lines and runs in under half a minute on a small ARM VM. Deliberately absent here: performance numbers. Run it on your own hardware against your own SLA - the Community Edition is free, and the quickstart gets you to a running server in under ten minutes.