One released build. Real hardware.
Unedited numbers.
A public performance and high-availability report for ARA Enterprise 1.0.3, measured on 21 July 2026 on AWS. Every figure on this page is copied from the run's output files. The environment, the method, the gates that could have failed the run, and the limits of what we measured are all documented below.
Three minutes, four questions.
The short version of this report is a film. The terminal you see is the actual test running; the charts are rendered from the run's own recorded metrics; the kill is real. If you watch nothing else, watch the failover sequence.
3:01 · captioned · chart cut-ins are rendered from the run's recorded Prometheus series (raw query data ships with the results).
What is actually being tested.
ARA is a decision data plane: it records every decision your models make and the feature values that shaped it, as they happen, and serves those values back on the inference path. Four ideas define what a benchmark of such a system must prove.
The decision record
One decision plus the facts behind it. In this test every record carries 300 features, the shape of a real decision in ad tech, fraud, or credit. Throughput is reported in records and in individual feature values, and the two are never conflated.
The replicated pair
Two servers act as one safe unit: a primary that accepts writes and a replica that applies an identical, byte-ordered stream in real time. A pair is only useful if the replica is provably attached, so attachment is a measured gate here, not an assumption.
Failover
When the primary dies, an arbiter quorum elects the replica, which promotes itself and begins accepting writes. The questions that matter are how long that takes, how much data is lost, and whether anything durably applied is lost. All three are measured.
Verification over trust
A system of record earns trust by being checked, not believed. This run verifies replication with sentinel write-throughs before measurement, compares stored values between the two machines after load, and includes a harness that reads back every value it writes.
Four machines, one released artifact.
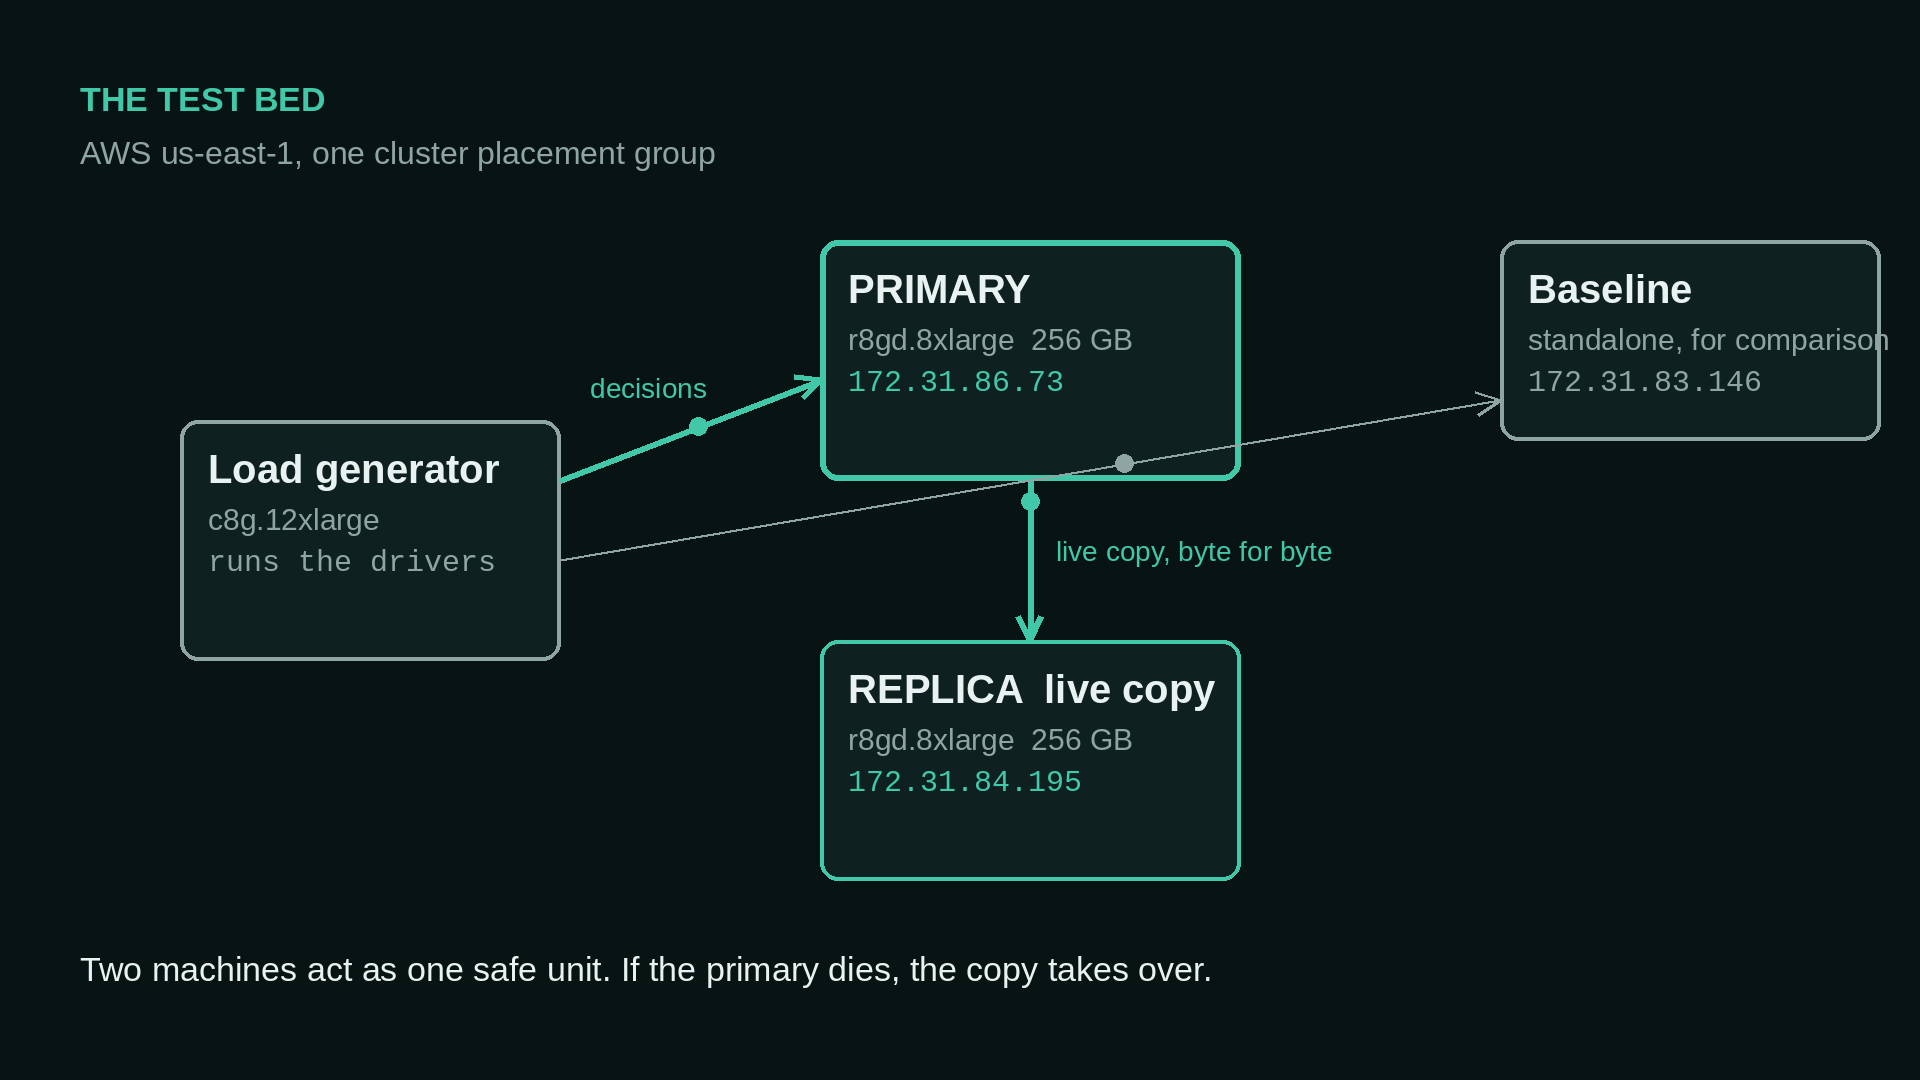
The test bed. Two r8gd.8xlarge servers form the replicated pair; a third runs standalone as a baseline; a c8g.12xlarge generates load. All four sit in one cluster placement group (measured RTT between nodes: ~0.12 ms).
| Component | Detail |
|---|---|
| Build under test | ARA Enterprise 1.0.3 (linux-aarch64), the shipped artifact. No test-only flags, no patched binaries. |
| Servers | 3x AWS r8gd.8xlarge: 32 vCPU (Graviton4), 256 GB RAM, 1.7 TB local NVMe mounted for chunk storage. |
| Load generator | 1x AWS c8g.12xlarge: 48 vCPU. Runs the Python driver and the Java verified-write harness. |
| Region / placement | us-east-1, single cluster placement group, Amazon Linux 2023. |
| Dataset shape | 1,000,000 entities x 300 registered features, bounded entity pool (writes are overwrites, history depth 8). |
| Server configuration | 8 partitions per server, history depth 8, defaults otherwise. Same flags on every node. |
| Observability | Prometheus + node_exporter + ARA's own server telemetry, scraped at 5 s. The metrics database from the run is archived. |
How the run was conducted.
The whole day is one scripted, resumable pipeline: launch, stage, preflight, then the phases below in order, each writing its raw output to disk before the next begins. Steps either pass their gates or fail the run. Nothing is hand-assembled after the fact.
| Phase | What it does | Gate that can fail it |
|---|---|---|
| Preflight | Verifies the same bundle version on all four machines, storage mounted, clients compiled. | Any mismatch aborts the day. |
| Baseline phases | Write, read, and mixed workloads against the standalone server. | Zero throughput or error rate above 1% fails the phase. |
| Pair bring-up | Starts arbiters, replica, primary; then 50 sentinel writes must be written through the primary and read back from the replica. | Any missing sentinel stops the run. Measurement never starts on an unverified pair. |
| Replication ladder | Stepped load against the pair. After every rung the replica must be attached: zero disconnects, sequence lag zero, byte offset lag zero. | A rung that ends detached is not counted as sustained. |
| Sustained run | 20 minutes at the highest sustained rung, followed by an attachment check and a value-level comparison of 300 sampled entities across both machines. | Any divergence fails the run. |
| Failover drill | Steady load, then kill -9 on the primary process. Measures detection to promotion, in-flight loss, durable loss, and automatic writer reconnection. | Loss of any durably applied write fails the drill. |
Measurement definitions
| Term | Definition |
|---|---|
| Write / record | One decision record: one entity updated with a full feature set in one operation. In this report a write carries 300 feature values unless stated otherwise. |
| Feature values /s | Writes per second multiplied by features per write. Reported separately so record rates and value rates cannot be confused. |
| Latency | Client-measured, on the load generator, from request to acknowledged completion. Percentiles are per-worker; the worst worker is quoted where workers differ. |
| Attached | Replica verdict requiring zero disconnects during the phase, applied sequence equal to the primary's, and byte offset lag of zero. |
| Data loss (drill) | Writes acknowledged-in-flight or unacknowledged at the moment of the kill that are absent from the new primary, counted by replaying the writer's own sequence log. |
Two deliberately different clients
The Python driver is the throughput instrument: 8 worker processes writing full 300-feature records in batches, counting only acknowledged writes. The Java harness is the correctness instrument: it reads back every value it writes before counting it, which caps its throughput near 5,000 verified values per second by design. Harness numbers are never quoted as throughput; they exist to prove effectiveness (100.0% in every rung) and reproducibility (the full ladder was run twice, hours apart, on a server rebuilt from scratch in between; results agreed within 0.5%).
- Every number on this page is copied from the run's output files. No rounding up, no re-derivation.
- The build under test is the released enterprise artifact, identical on every node, verified in preflight.
- Gates that could have failed the run are part of the method. A failed gate means a discarded result, not a footnote.
- Charts are rendered from the run's recorded metrics database, which is archived along with every raw output file.
- What we did not measure is stated in section 07.
What the machines printed.
5.1 · Sustained ingestion, replicated
Twenty minutes at the ladder's highest sustained level, one primary ingesting full decision records while streaming a live copy to its replica.
| Metric | Value |
|---|---|
| Sustained write rate | 46,085.6 writes/s for 1,200.1 s |
| Feature values per second | 13,825,680 values/s |
| Total writes / errors | 55,307,600 / 0 |
| Client latency per 100-record batch | p50 16.5 ms · p99 29.2 to 34.3 ms across workers (~0.17 ms per 300-feature record) |
| Replication stream | ~550 MB/s sustained to the replica |
| Replica verdict after run | ATTACHED · sequence lag 0 · byte lag 0 |
| Server memory | Plateaued at 105.3 GB against a predicted 105.6 GB (see sizing) |
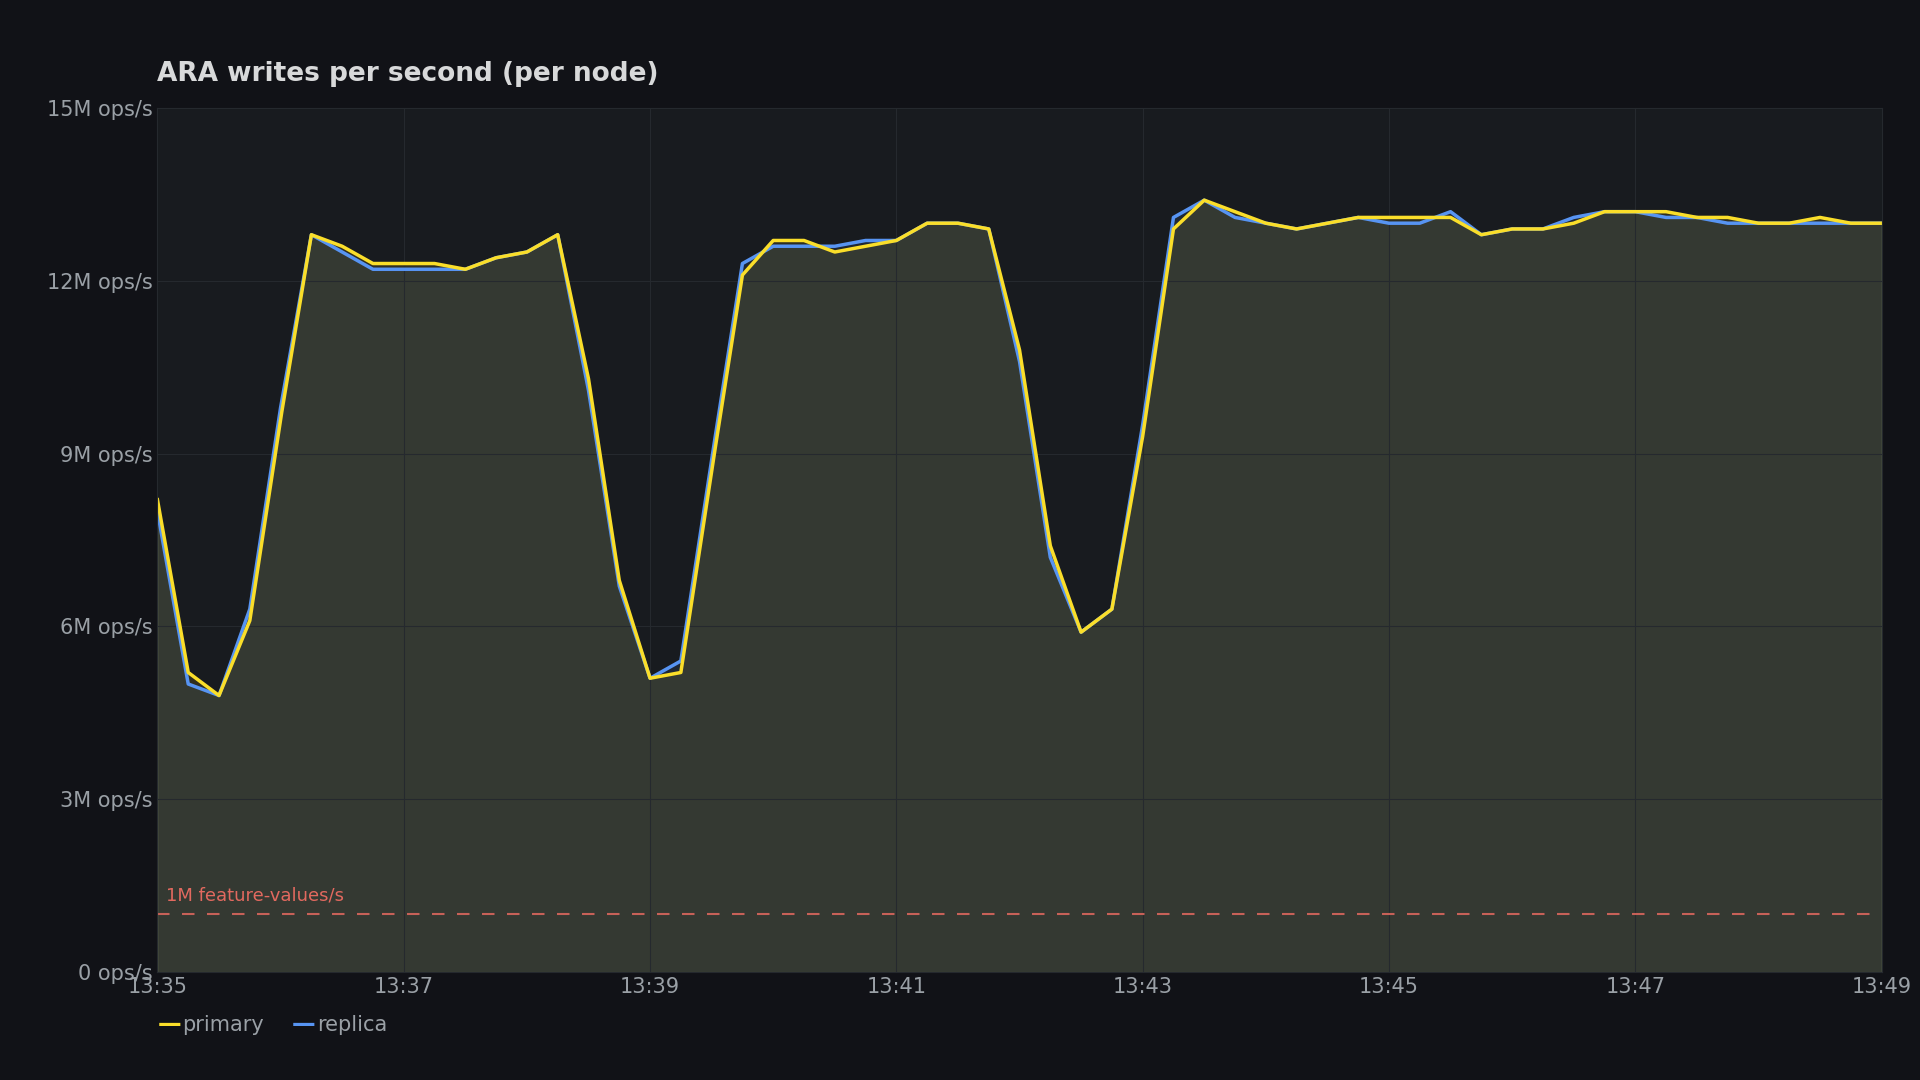
Writes per second per node, rendered from the run's recorded metrics. Primary and replica overlap through the ladder rungs and the sustained plateau; the dashed line marks 1M feature values per second for scale.
5.2 · Reads on the serving path
ARA sits beside inference, so reads are measured as full-record fetches, not single-key lookups, and the mixed phase runs reads and writes concurrently against the same server.
| Metric | Value | |
|---|---|---|
| Pure read phase | 5,614.5 reads/s | |
| Payload per read | Full 300-feature record (~1.68M feature values returned per second) | |
| Read latency | p50 0.97 ms · p99 1.93 to 1.96 ms across workers · max 3.3 ms | |
| Reads completed / errors | 4,042,624 / 0 | |
| Mixed phase (concurrent) | 5,581.6 writes/s + 5,545.0 reads/s | |
| Mixed error rate | 189 of 8,062,461 operations (0.0023%) |
5.3 · Replication ladder
Load against the pair steps up rung by rung. A rung only counts as sustained if the replica finishes it attached: zero disconnects, zero sequence lag, zero byte lag. All four rungs passed.
| Rung target | Achieved (records/s) | Disconnects | Seq lag | Byte lag | Verdict |
|---|---|---|---|---|---|
| 2,000 | 15,896.3 | 0 | 0 | 0 | ATTACHED |
| 5,000 | 37,178.2 | 0 | 0 | 0 | ATTACHED |
| 10,000 | 41,956.8 | 0 | 0 | 0 | ATTACHED |
| 20,000 | 46,085.6 (sustained 20 min) | 0 | 0 | 0 | ATTACHED |
Achieved rates exceed rung targets because the driver's pacing is intentionally loose; the attachment gates judge the replica, not the pacing. All records are full 300-feature writes.
5.4 · Failover drill
Under steady load, the primary process was killed with kill -9. No graceful shutdown, no draining, no warning. The coordinator detected the silence, won the arbiter vote, promoted the replica, and the writer reconnected on its own.
| Metric | Value |
|---|---|
| Detection to promotion | 2,802 ms |
| Human involvement | None |
| Writes lost | 53 in-flight writes, a contiguous tail = 53.0 ms of traffic |
| Durably applied data lost | 0 |
| Post-failover | Writer reconnected automatically; 14,241 writes acknowledged on the new primary before the drill ended |
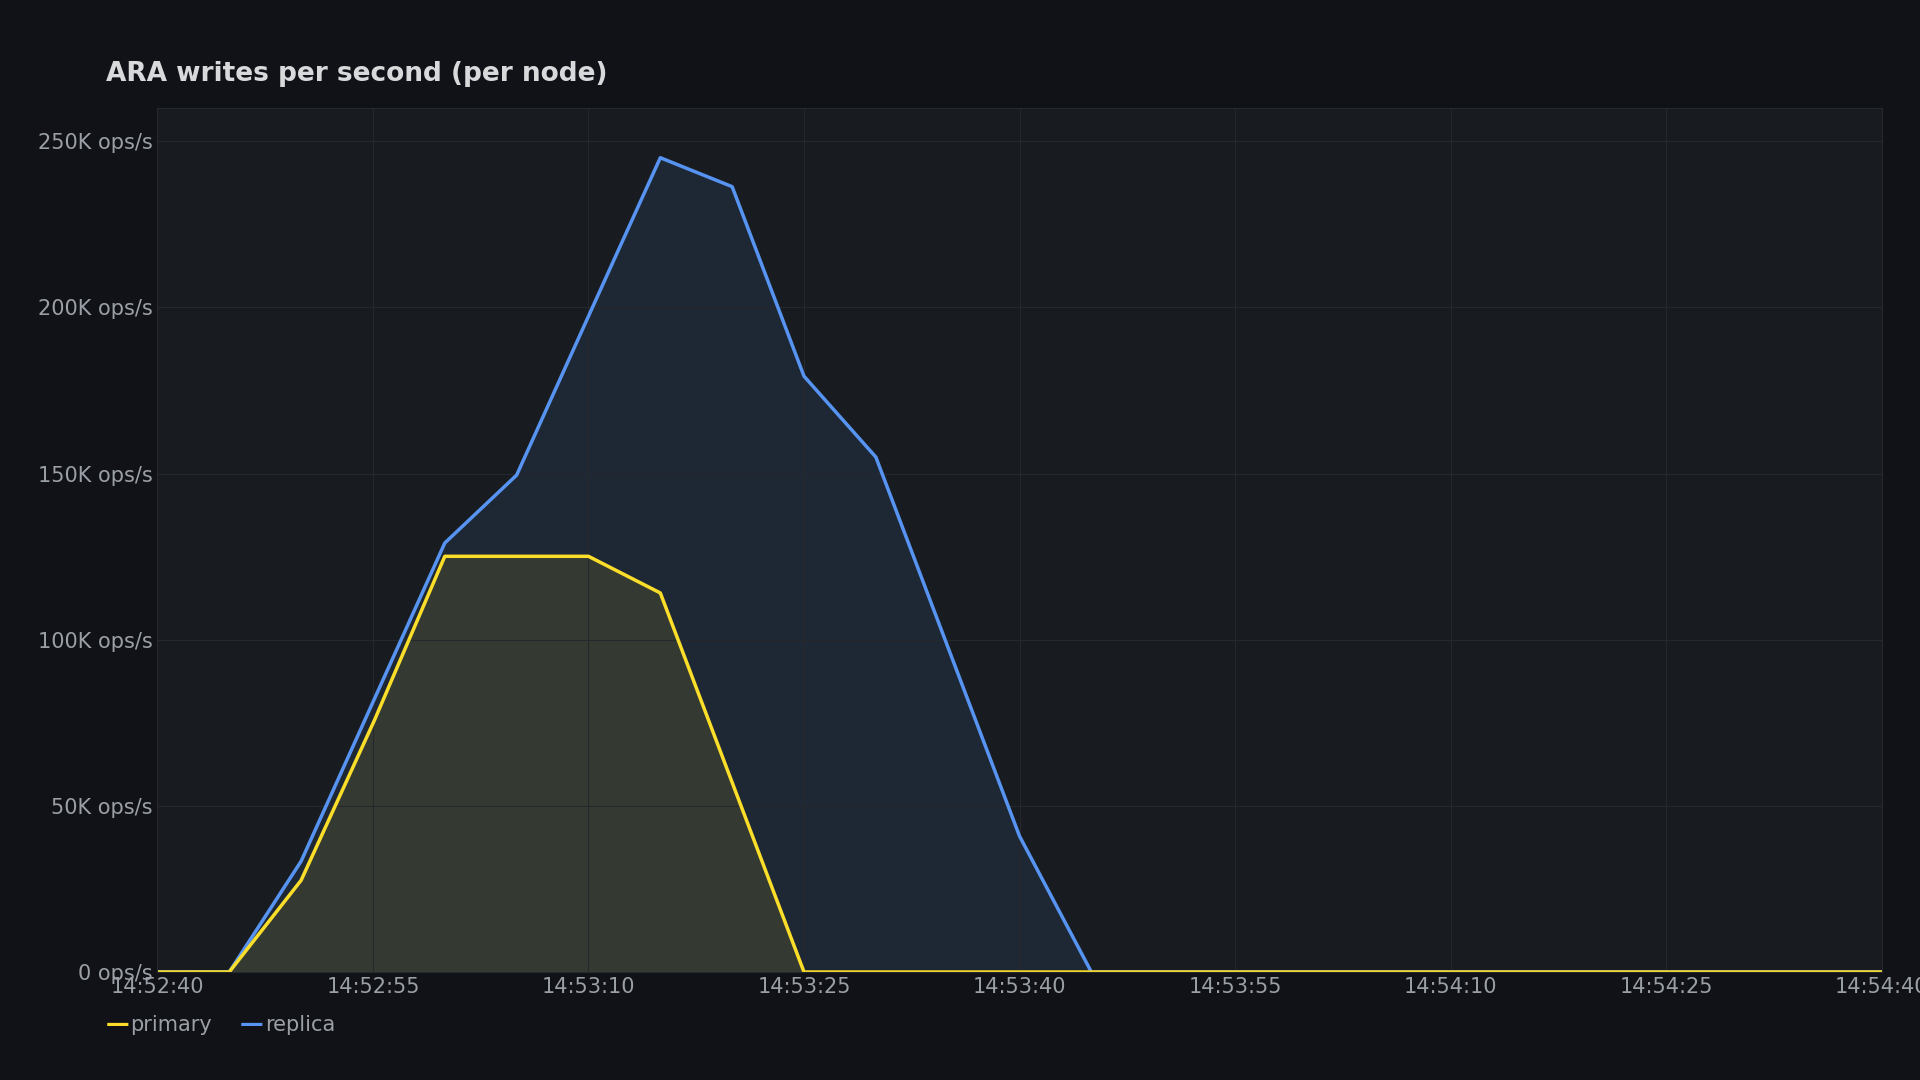
The kill moment, rendered from the run's recorded metrics. The primary's line stops when the process dies; the promoted replica absorbs promotion, catch-up, and the post-failover writes.
5.5 · Verification
| Check | Result |
|---|---|
| Sentinel write-through (before measurement) | 50 of 50 sentinels written through the primary and read back from the replica |
| Value-level comparison (after sustained run) | 300 sampled entities compared value by value across both machines: 300 identical, 0 mismatched |
| Verified-write harness | Every value read back after writing: 100.0% effective in every rung of both ladder runs |
| Reproducibility | Full ladder executed twice, hours apart, server rebuilt from scratch in between: results within 0.5% |
Plan it on a spreadsheet.
These factors are arithmetic on the measured numbers above, nothing more. We publish no multi-pair scaling claims because we have not measured multi-pair topologies yet.
Measured live: 1M entities x 300 features x history 8 predicted 105.6 GB; the server plateaued at 105.3 GB. Memory scales with what you choose to remember, not with write rate.
| Per 1,000 decisions/s (300 features each) | Budget |
|---|---|
| Chunk storage write throughput | ~42 MB/s |
| Replication network | ~12 MB/s |
| Disk footprint | ~140 bytes per feature value; size retention to your history window |
A worked example: a fraud stack making 10,000 decisions per second at this feature width needs roughly 420 MB/s of local NVMe write budget, 120 MB/s of replication bandwidth, and memory set by its entity count and history depth. That is about a quarter of the load the pair in this report carried, on hardware you can rent today.
One planning note we learned the honest way: at 46,000 decisions per second this workload writes ~1.9 GB/s of chunk data. Provision storage and archival headroom for your peak rate and retention window; our sustained run filled a 1.7 TB drive in roughly 15 minutes when archival was outpaced. Sizing conversations in a pilot start exactly here.
What this report does not claim.
- Single-pair topology only. All replicated results are one primary and one replica with three arbiters. Multi-pair and partitioned-fleet scaling were not measured and are not claimed.
- Read throughput is quoted at the tested concurrency. The read phase used 6 workers over the network; it is a serving-path latency result, not a saturation ceiling.
- The verified-write harness is not a throughput instrument. Its ~5,000 values/s is bounded by its own read-back verification, by design, and is quoted only as a correctness and reproducibility result.
- In-flight loss is workload-dependent. The 53 ms loss window was measured at the drill's write rate; a faster writer loses more in-flight writes in the same window. Durably applied data lost was zero, and that is the invariant we engineer for.
- One region, one AZ, one placement group. Cross-AZ and cross-region replication latencies were not measured here.
- Numbers come from one day's run on the stated hardware. Your environment will differ; that is what pilots are for.
The drill travels.
Everything in this report ran on ARA Enterprise 1.0.3 exactly as we ship it to customers. The same scripted pipeline, including the kill drill, runs against your data shape in an enterprise pilot: your feature width, your entity count, your rates, your hardware. We publish what the machines print, and we hold pilot runs to the same gates.
The Community Edition is free and runs the same core single-node engine if you want to start smaller. Raw output files and the run's metrics database are available to serious evaluators on request.